

Know Bitcoin's risk regime, every day.
A daily four-state read of the market, mapped to a clear Bitcoin/cash allocation, with the analysis behind every call.
Start nowWelcome to Bitcoin Vector
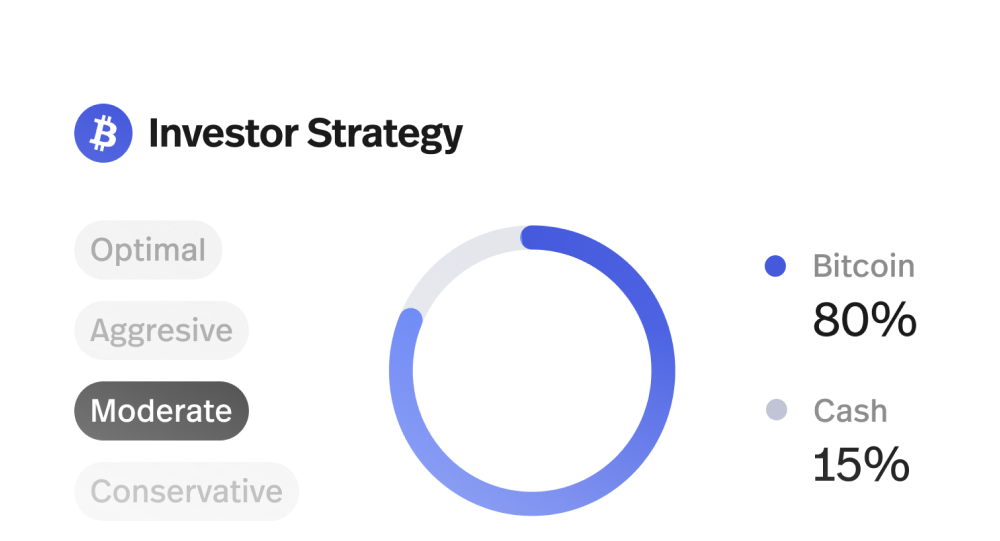
The read tells youexactly what to do
Data-driven
risk architecture
Navigating digital asset cycles without emotional bias requires an empirical lens. This algorithmic framework evaluates momentum thresholds and capital flows to isolate distinct risk regimes, providing statistical validation of market conditions ahead of major inflections.
Markets move in regimes
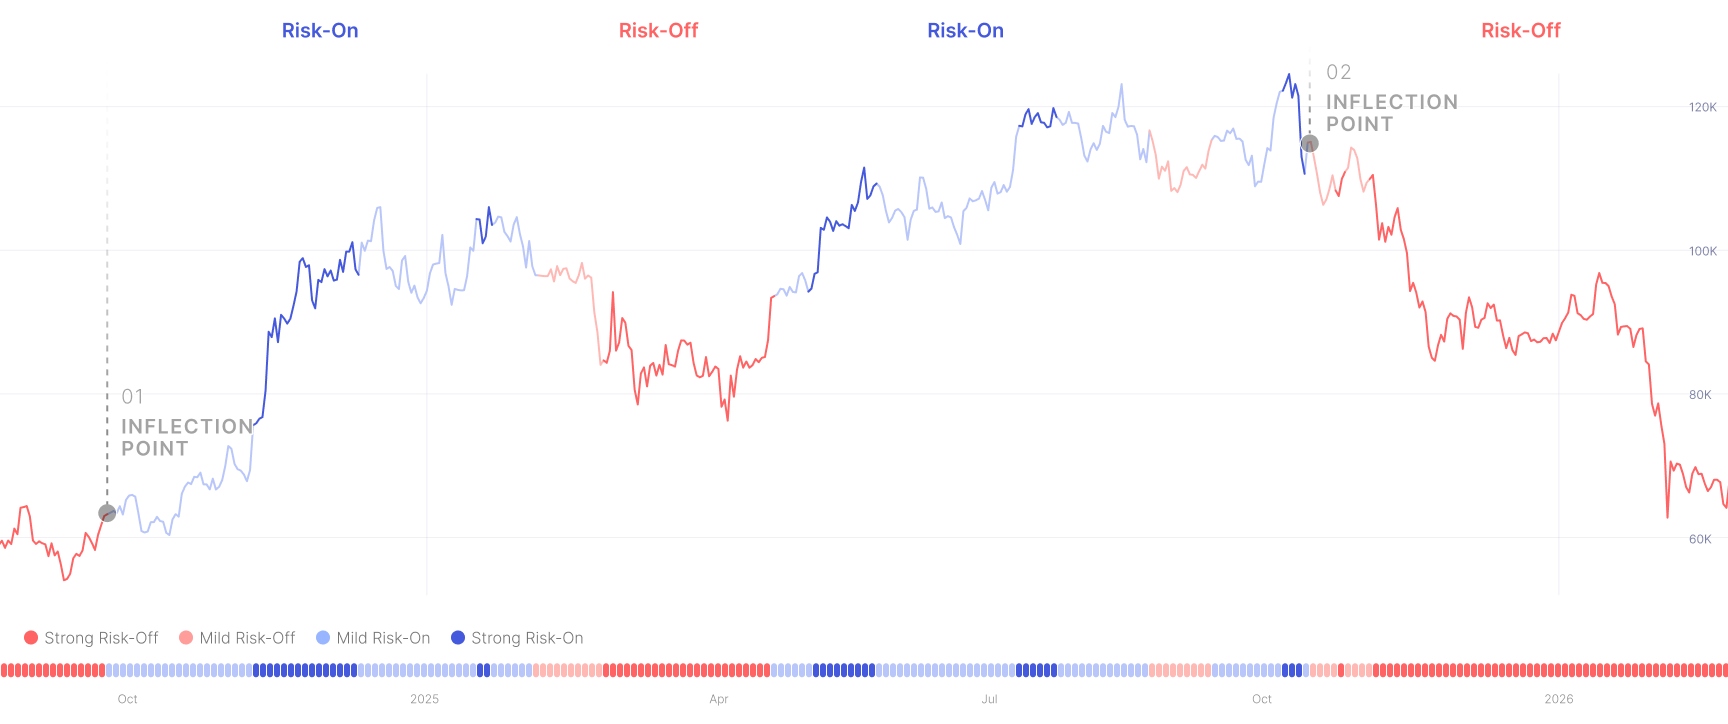
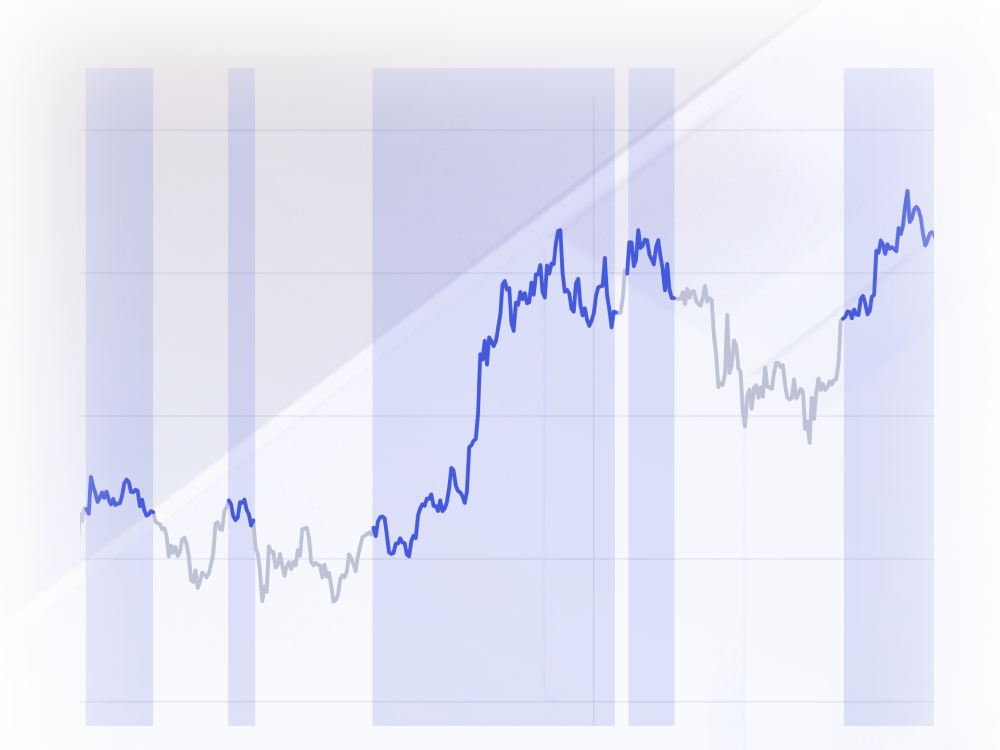
Mastering Bitcoin requires understanding the current market regime. Our Risk-On/Off Daily Signal tracks global risk appetite across four data-driven states that identify the current market regime.
A Risk-On environment indicates broad investor confidence, where capital typically flows into growth assets like Bitcoin. Conversely, a Risk-Off shift highlights liquidity withdrawal and structural market weakness, signaling a historical tendency toward capital preservation.
The inflection is the signal
The key to navigating Bitcoin is identifying the inflection points between Risk-On and Risk-Off. Observing these structural shifts helps clarify whether global investor confidence is expanding or if systemic weakness is beginning to develop.
Tracking these turning points provides data on changing market conditions and mounting macro risks. It serves as an objective warning system, illustrating how market cycles behave as conditions transition toward a defensive stance or prepare for expansion.
Know the context. Execute the move.
Get the charts, commentary, and research behind the signal, then act with clarity instead of treating the market like a roulette wheel.
The track record
24 months. $206K of edge on a $100K position.
Across 2024 and 2025, on a $100K base, the Risk-On/-Off secured $133K of upside across four Risk-On periods and shielded $73K of drawdown across four Risk-Off periods. Every call published before price confirmed.
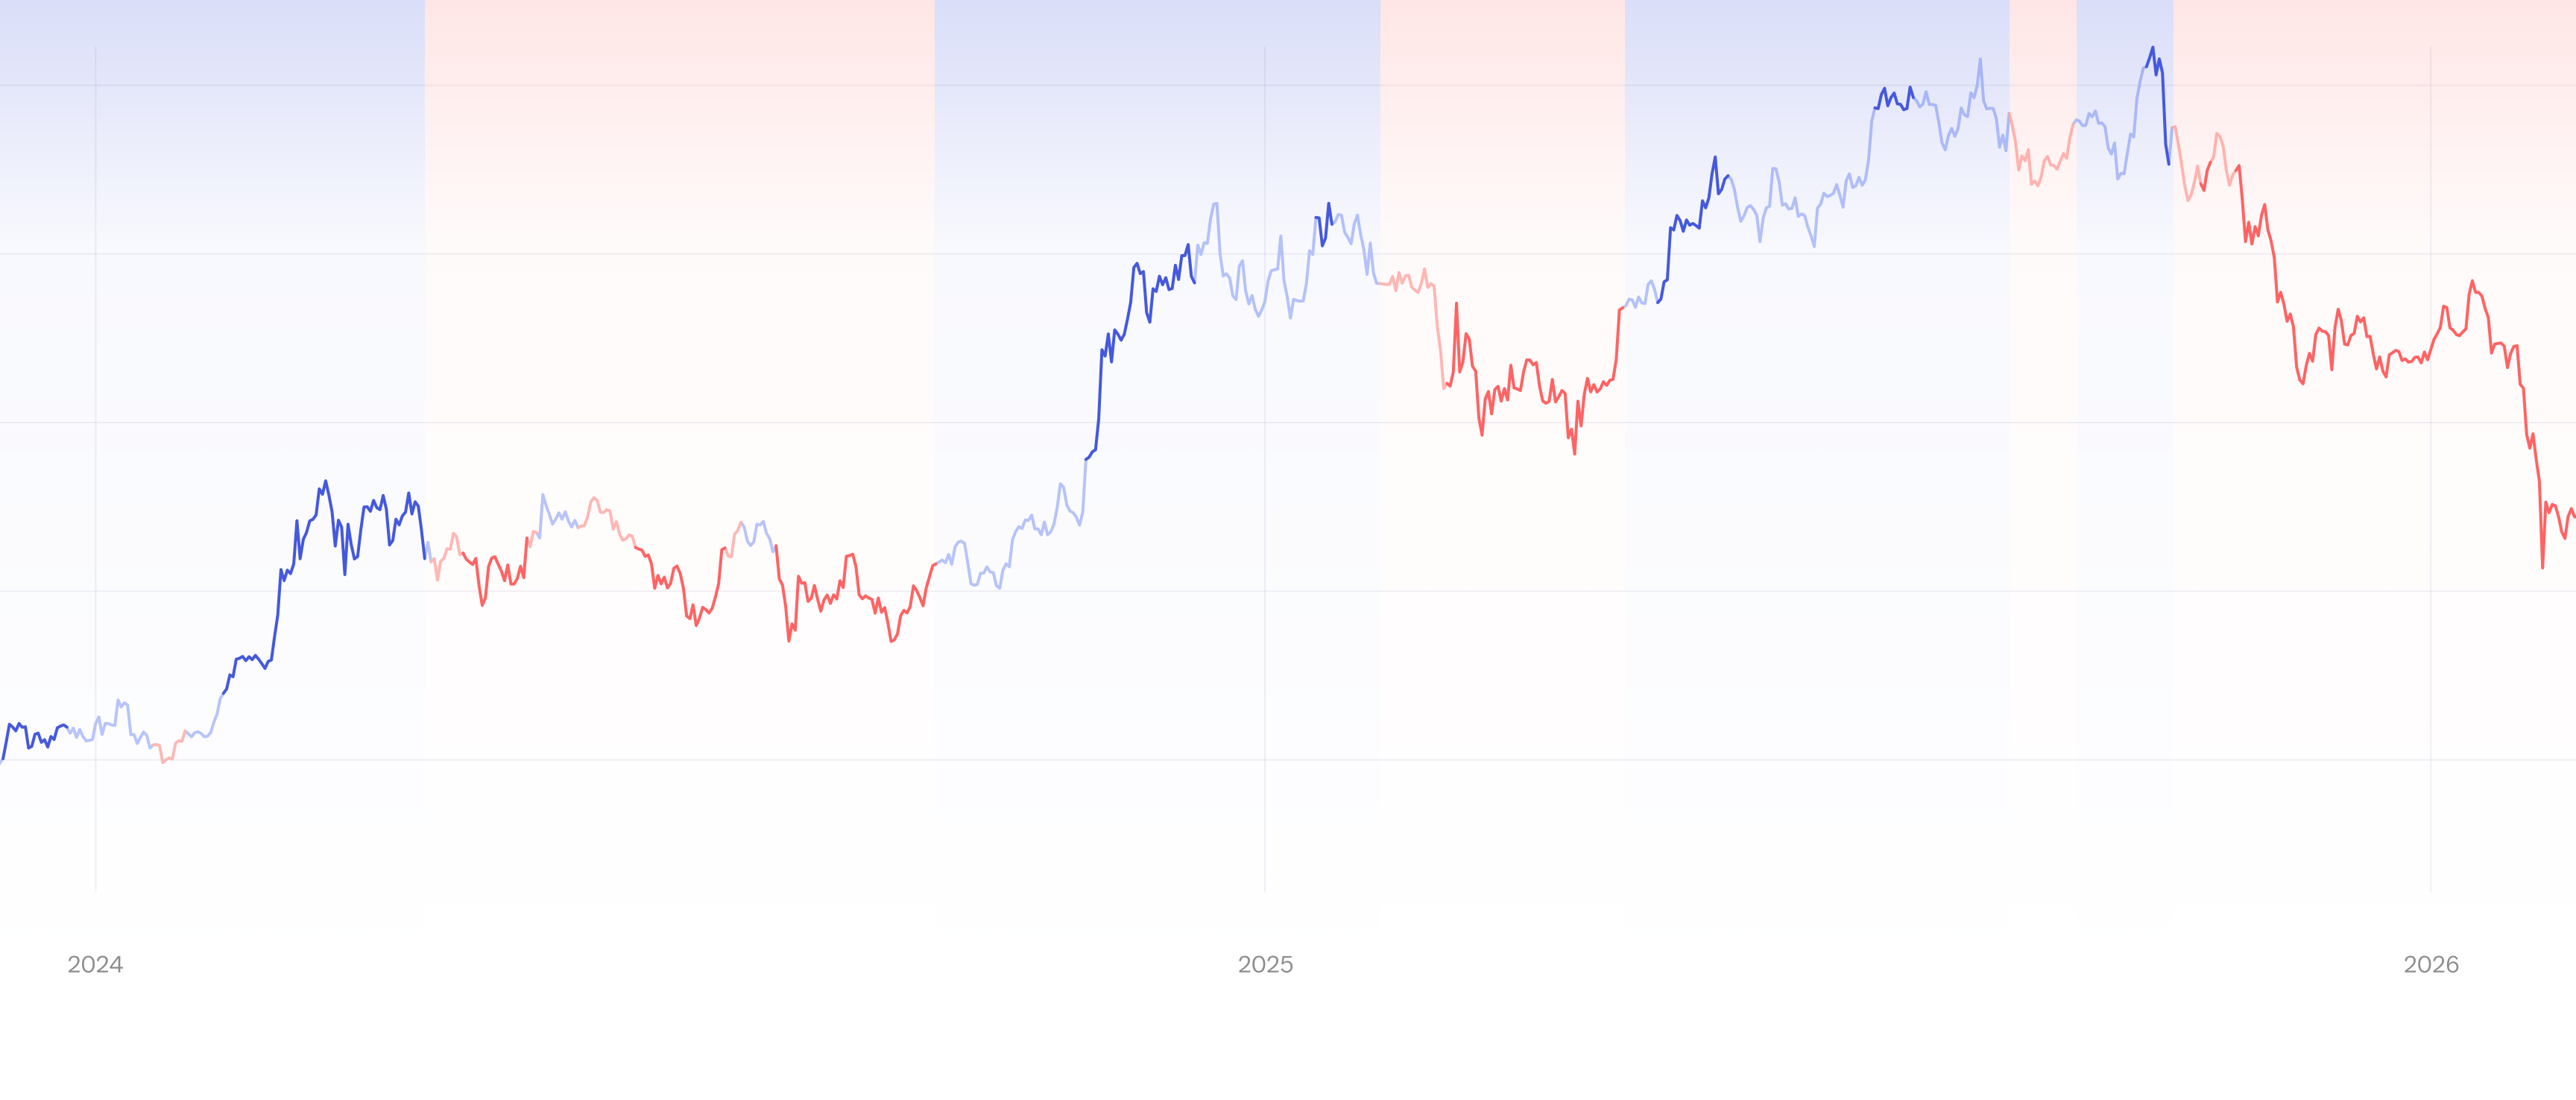
The framework identified genuine bearish intent following the October 10 crash, keeping us 100% in cash for over four months, avoiding up to a 45% drawdown.
Get today’s read
$749/mo - billed quarterly*
Bitcoin insights from a trusted voice.
Subscribe now- Risk-On/Off regime detection
- BTC/cash allocation signal
- Real-time alerts
- Twice weekly: expert Bitcoin analysis
*Prices are exclusive of tax, local tax rates will be calculated at checkout.
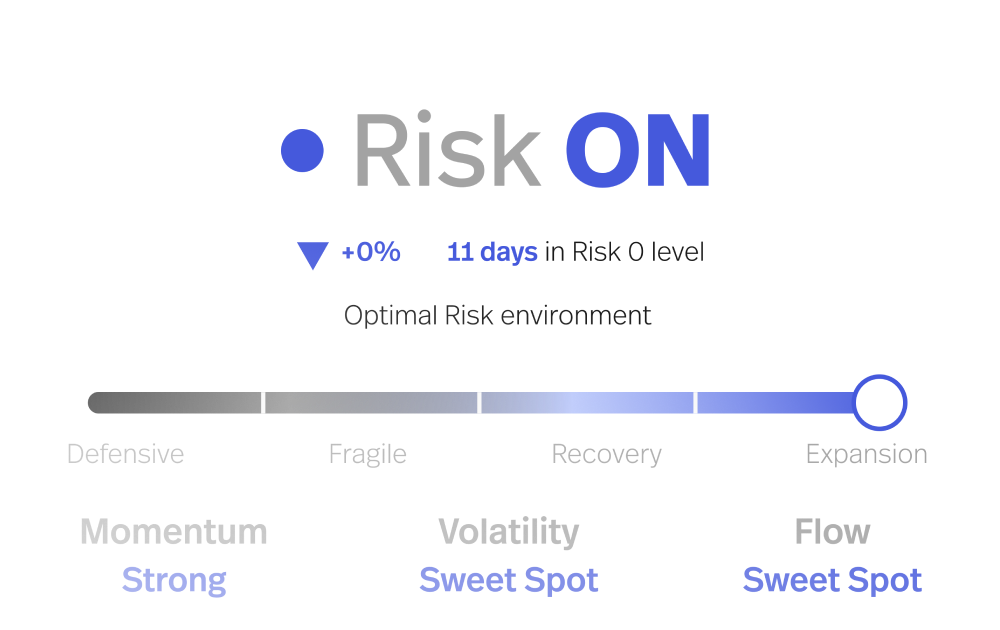
The metrics behind the edge
Bitcoin Vector transforms market strength, volatility, and systemic risk into clear allocation guidance. Each metric serves a specific role: defining exposure, identifying risk regimes, and confirming when Bitcoin conditions are strong enough to stay invested.


See which product fits you best
From BTC-specific regime signals to broader expert-led crypto research, compare both solutions and find the one that fits your investment approach.
- Main focus
- BTC market regime
- What you get
- Daily BTC regime + allocation signal
- Timeframes
- Long, mid and short-term BTC readings
- Metric approach
- Individual metric per timeframe
- Key value
- Know when BTC conditions are Risk-On or Risk-Off
- Best for
- Clear BTC allocation guidance
- Main focus
- Broader crypto market analysis
- What you get
- Daily analyst-led deep-dive insights
- Timeframes
- Long, mid and short-term combined metric readings
- Metric approach
- Multiple metrics interpreted together
- Key value
- Identify broader crypto inflection points with expert context
- Best for
- Deeper market interpretation across digital assets
* Prices are exclusive of VAT.