

The Market Compass
Read the Market Like an Analyst.
See the crypto market the way the experts do. One clear read, every day, from Risk-Off to Risk-On.
- Updated every day
- Written by our analysts
- Advanced & Professional
One Read, Seven Lenses, Scored Daily.
See how thousands of Glassnode metrics become a single daily read, and what sits underneath it.
Take a Look Inside
Scroll Through the Dashboard.
A live snapshot of the Market Compass. Scroll inside the window to explore the read, the lenses and the charts beneath them.
What It Is
Too Much Information, One Clear Read.
The Problem
There is simply too much to follow. Thousands of charts and dozens of indicators, with no clear way to tell, on any given day, what actually matters.
The information is all there. Making sense of it is the hard part.
The Answer
The Market Compass reads it for you. It takes thousands of Glassnode metrics and turns them into one clear picture of where the market stands, from Risk-Off to Risk-On.
A simple map of where things stand. It never tells you to buy or sell.
How To Read It
Seven Lenses, One Score.
Each lens is a plain read on one part of the market. Here is how they come together into a single score.
The Composite Score
The one number the Compass gives you each day, from 0 to 100. Low is Risk-Off, high is Risk-On. It tells you where the market stands today. Right now it reads 14, deep in Risk-Off.
Leading Lenses · Four
The four reads that build the score. They are called leading because they tend to turn early, before a shift fully shows up in price, so combined they set the number and the score moves with them.
Standalone Lenses · Three
Three more reads that add context. They are called standalone because each stands on its own, read beside the score rather than mixed into it, so they never move the number.
Leading Lenses · These Four Build the Score
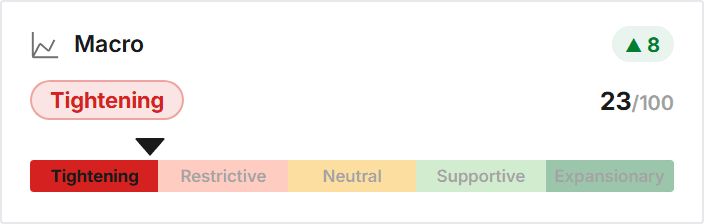
Macro
The rates and dollar backdrop. Still tight, which keeps a lid on risk.
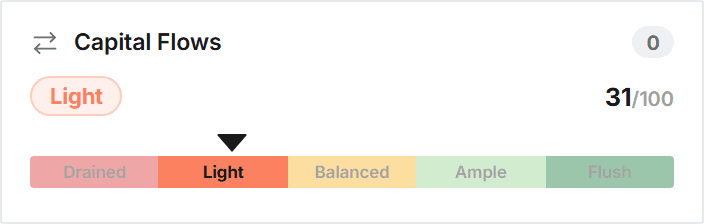
Capital Flows
How much money is flowing in. Right now, on the light side.
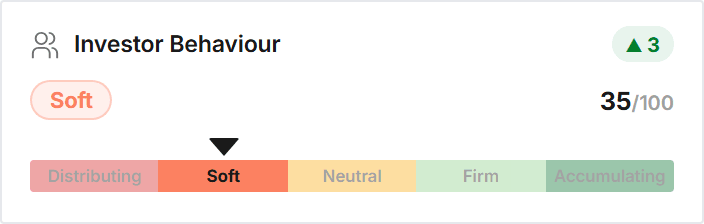
Investor Behaviour
Whether holders are adding or selling. Currently soft.
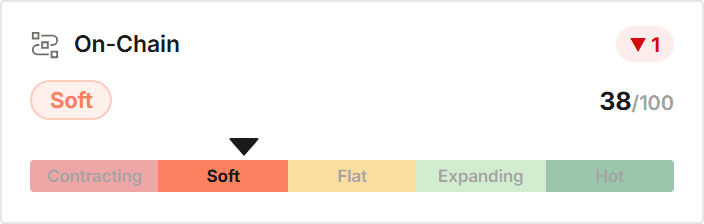
On-Chain
How much the network is actually being used. Also soft.
Standalone Lenses · Context Beside the Score
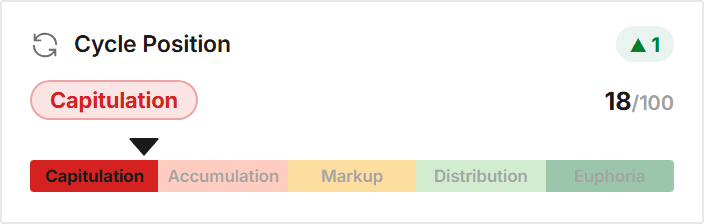
Cycle Position
Where we sit in the broader cycle. Deep in capitulation.
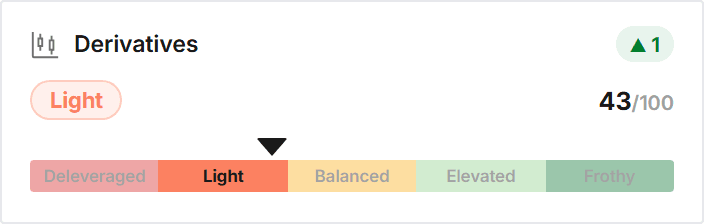
Derivatives
How much leverage is in the market. Fairly light.
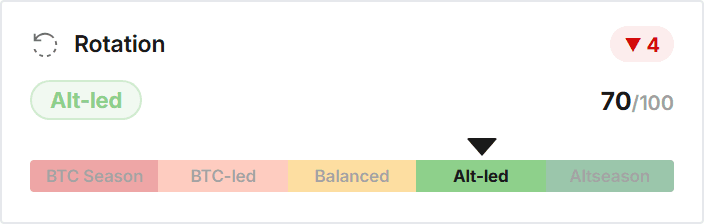
Rotation
Bitcoin versus the rest of the market. Tilted to alts.
Under Each Lens
The Analysts' Own Charts, Built for the Compass.
Beneath each lens sit the charts the team reads daily, custom-built for the Compass.
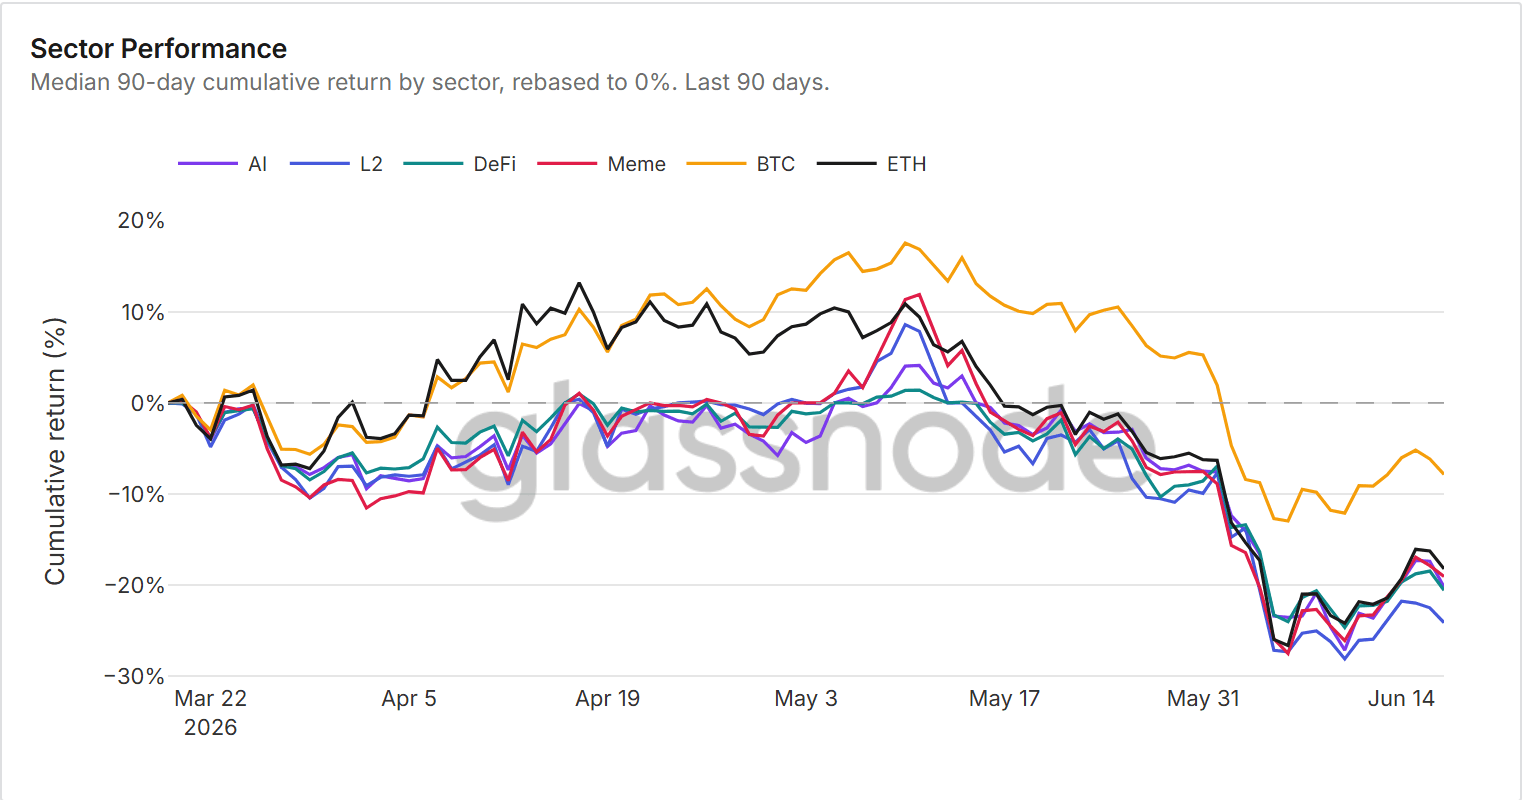
Sector Performance
Median 90-day cumulative return across the major crypto sectors.
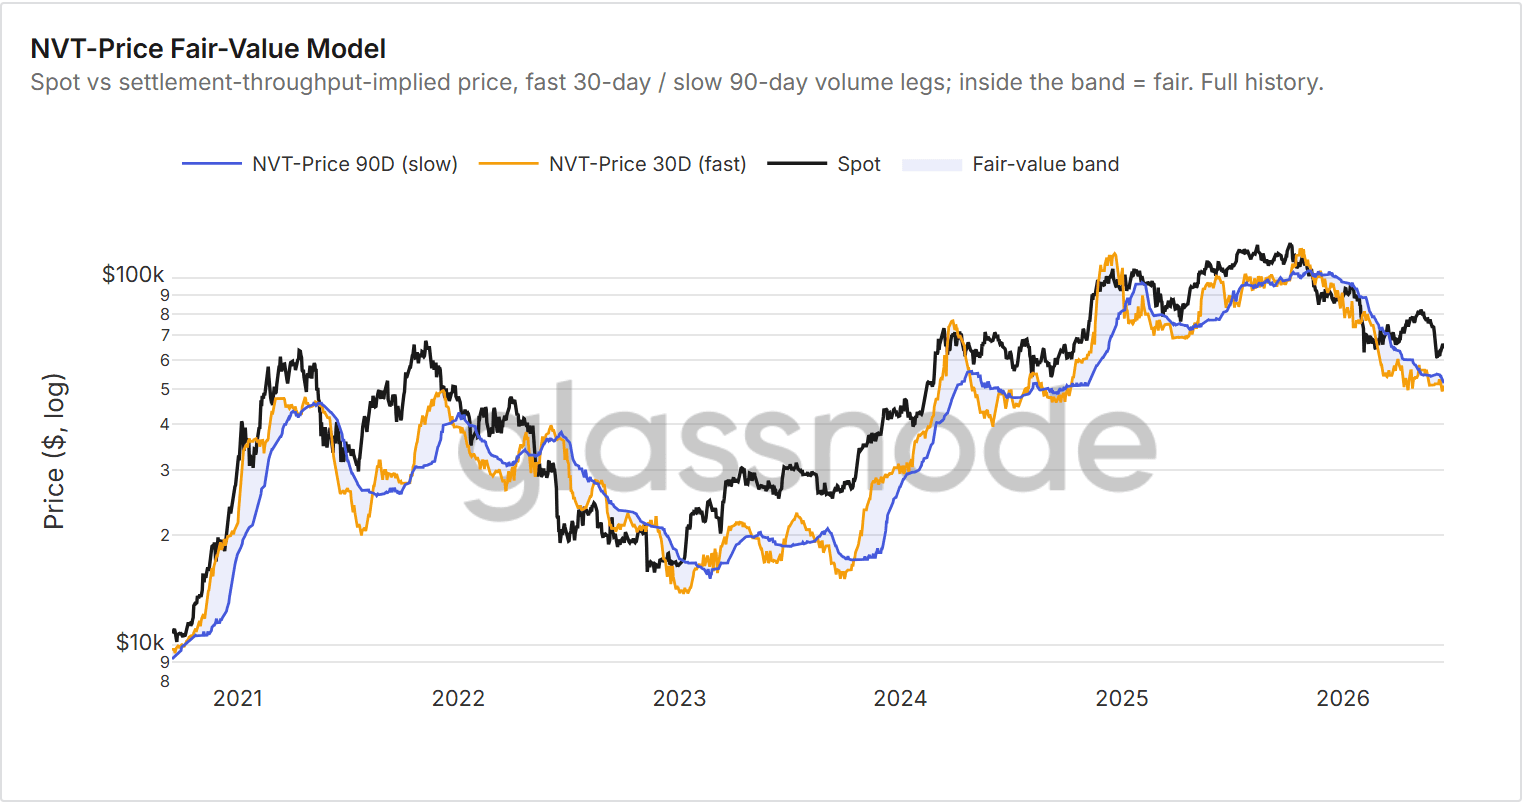
NVT Fair-Value Model
A price fair-value read from network value to transactions.
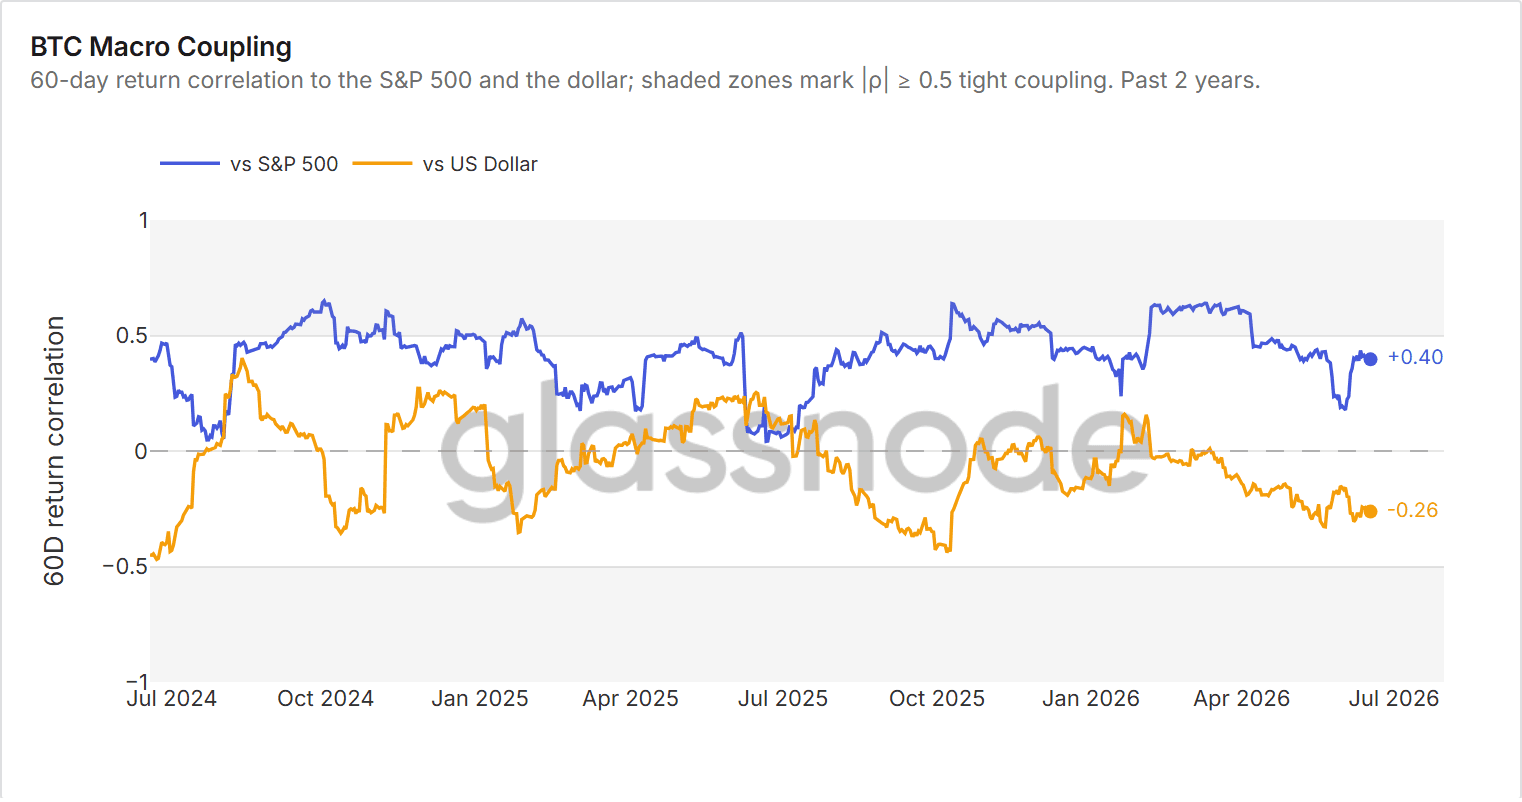
BTC to Macro Coupling
How tightly Bitcoin is tracking broader macro conditions.
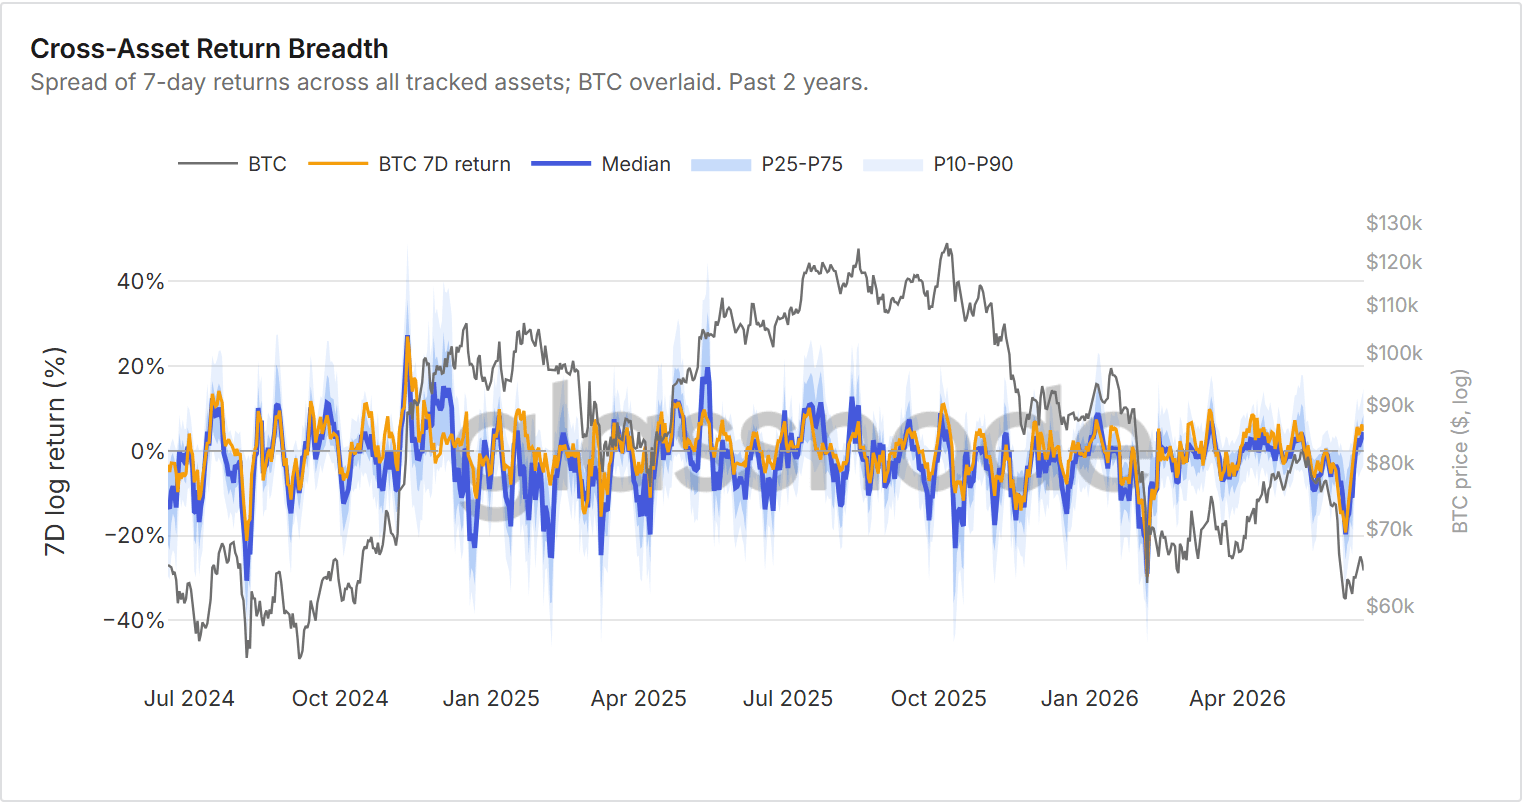
Cross-Asset Return Breadth
Return breadth across the broader cross-asset set.
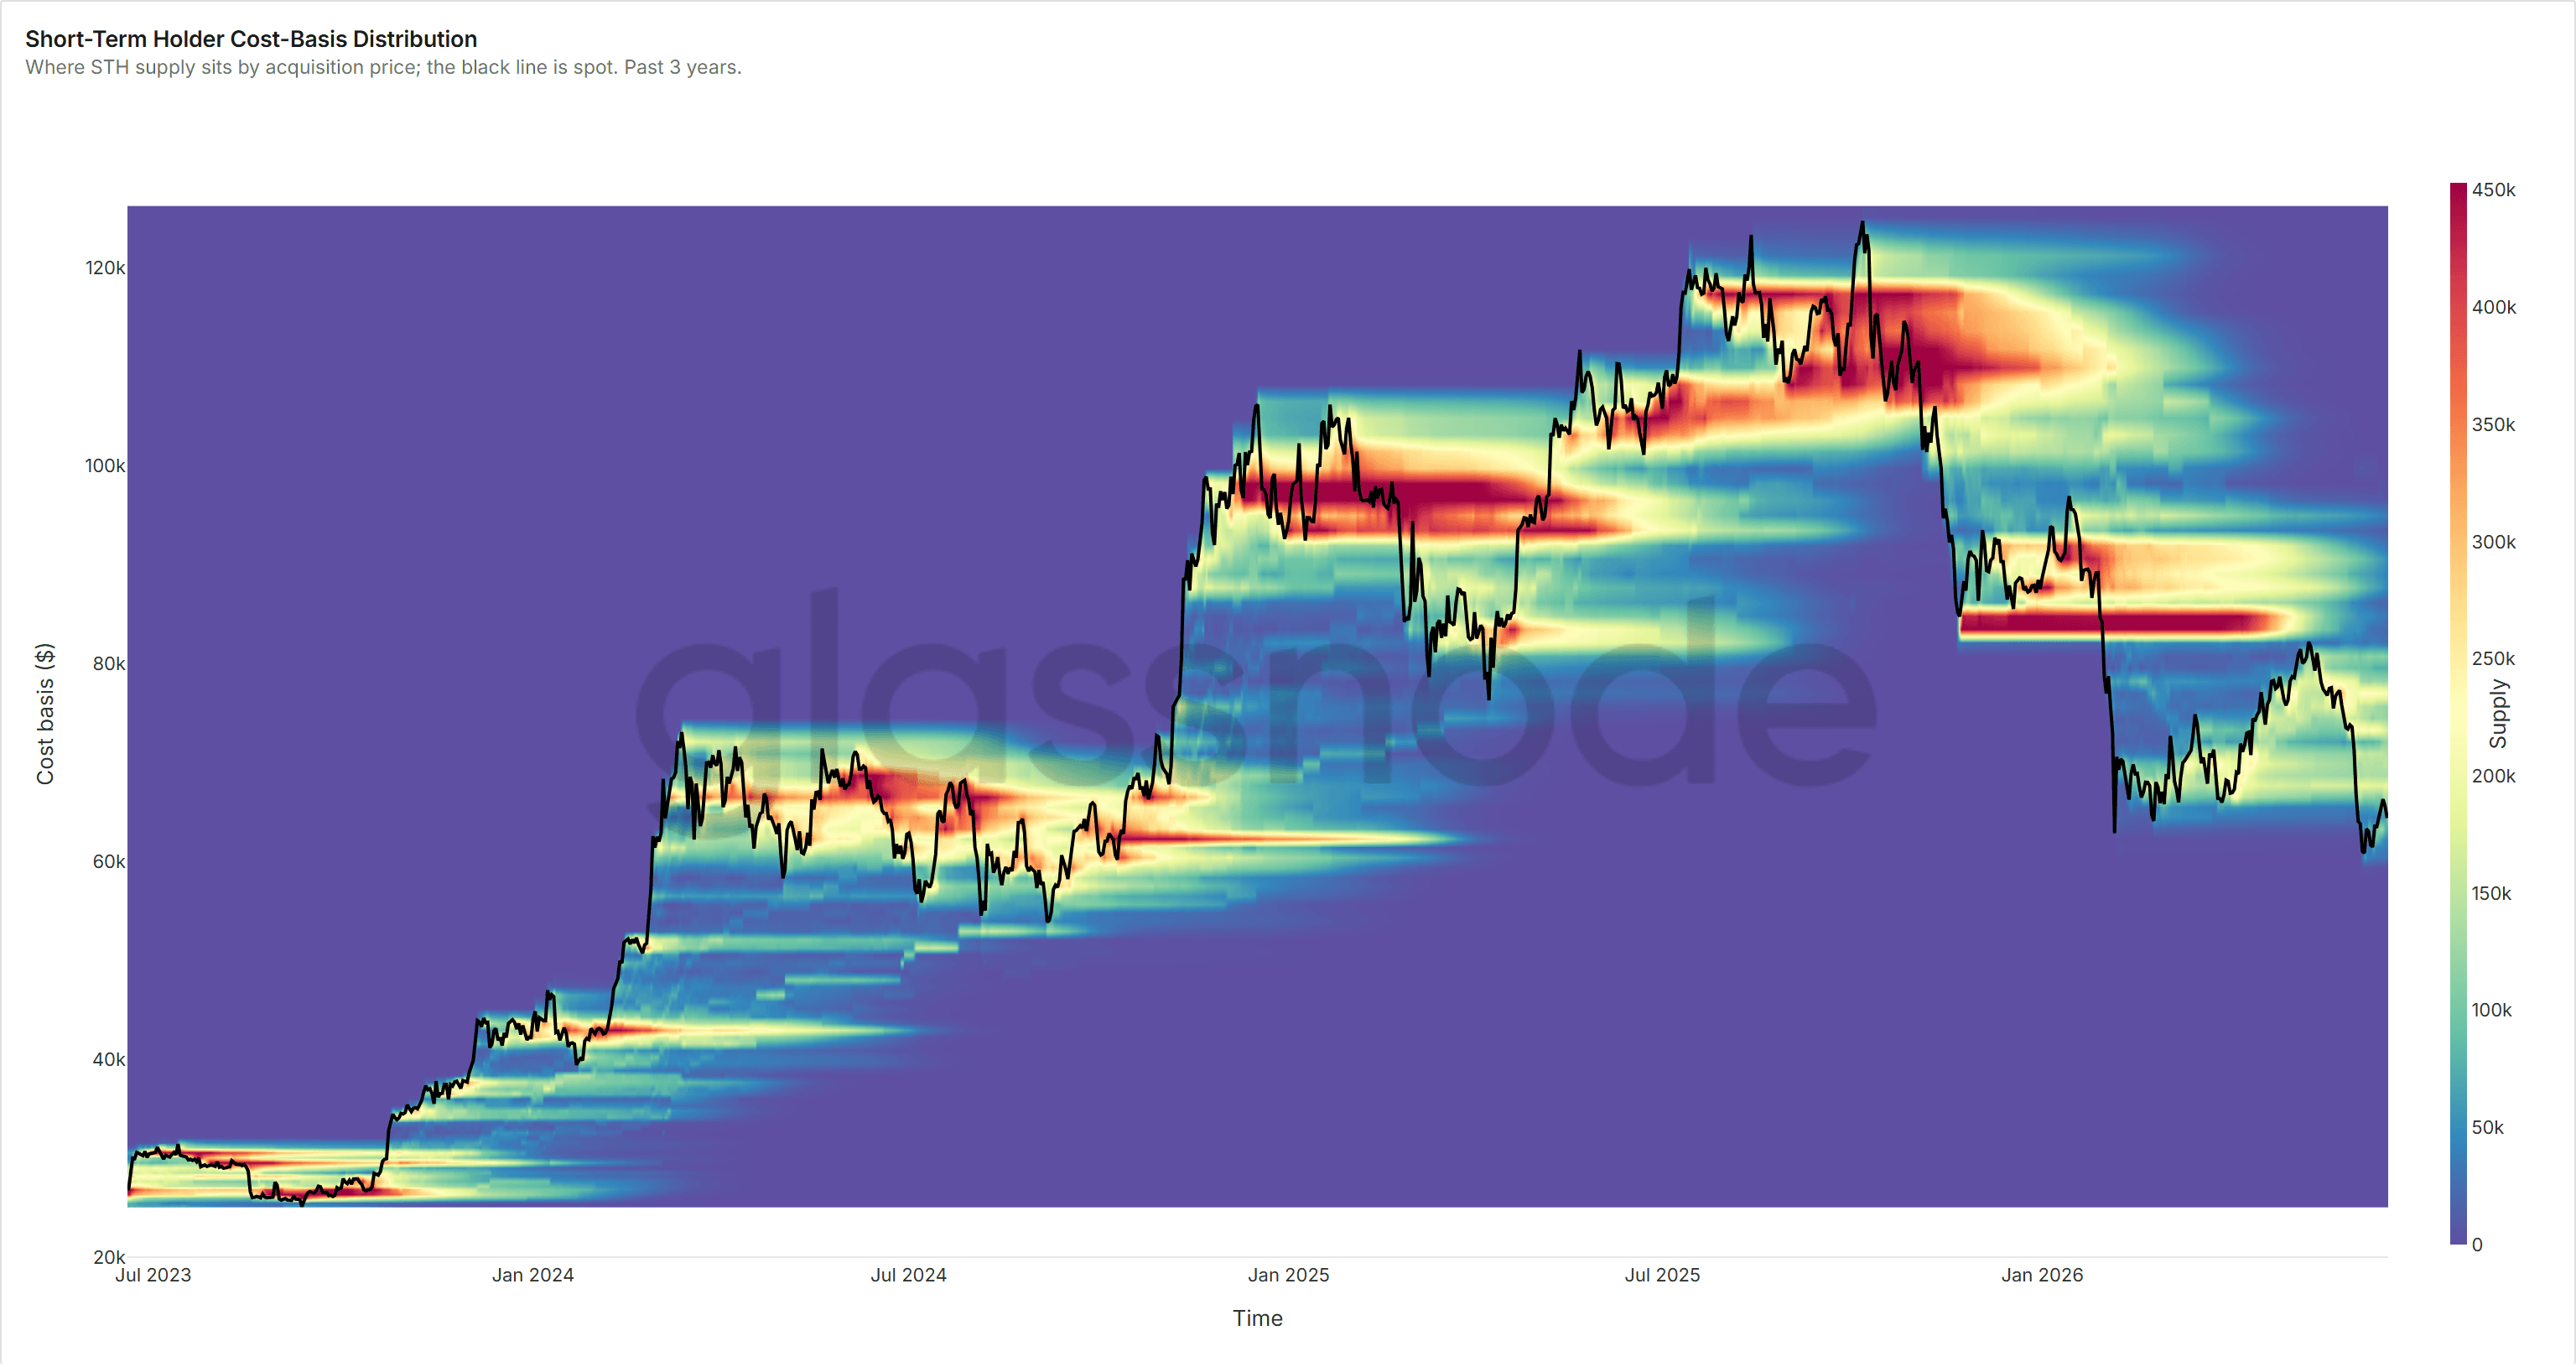
Short-Term-Holder Cost Basis
Where price sits against recent buyers' cost basis.
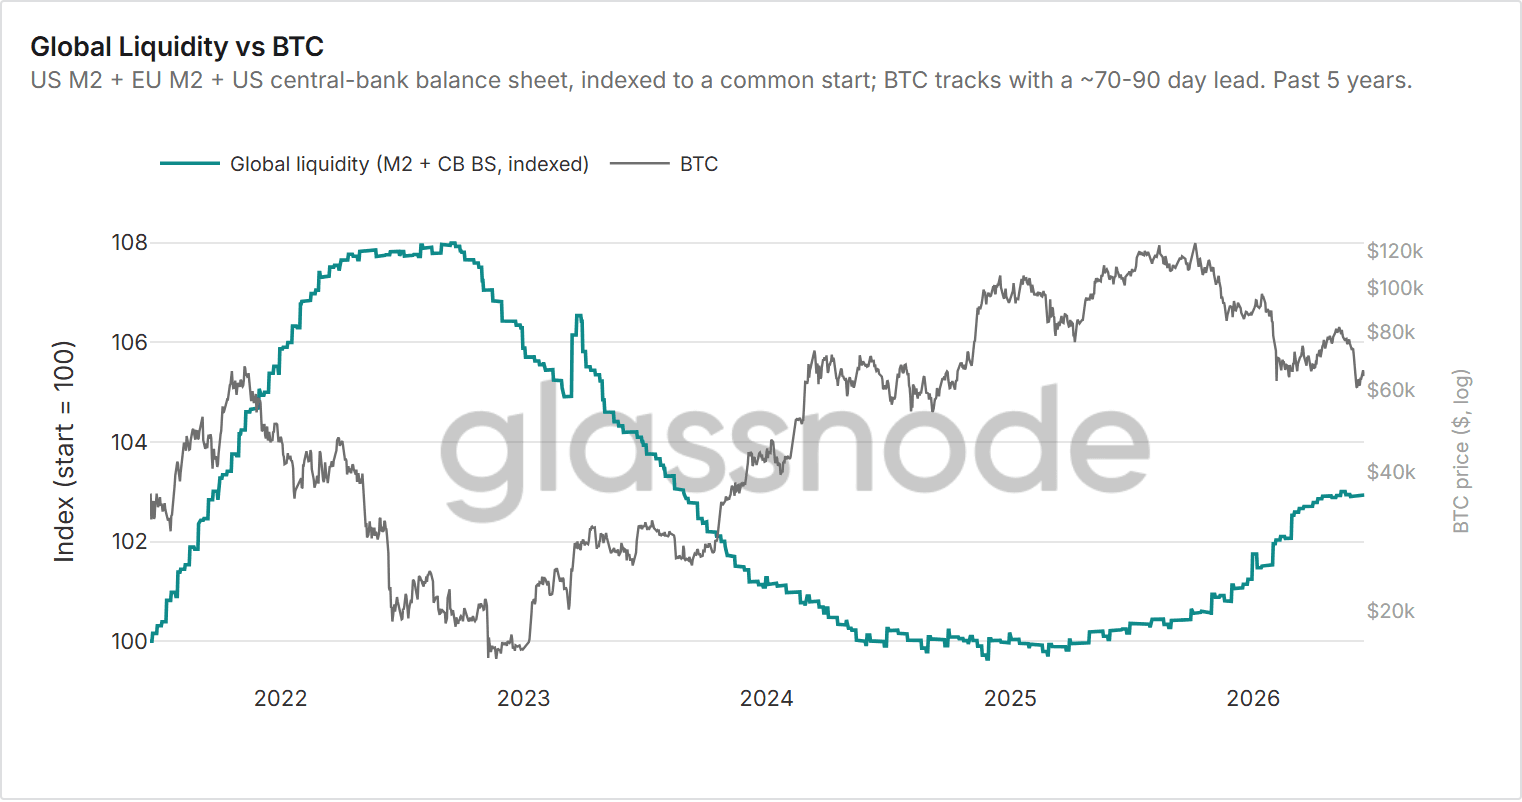
Global Liquidity
The liquidity backdrop feeding the Capital Flows lens.
Why It Helps
The Whole Market, Read Down to One Number.
There is too much to follow on your own. The Compass does the watching, the grouping and the reading, so you do not have to.
Thousands
Metrics Watched
Every Glassnode metric our analysts rely on, tracked for you, every day.
Seven
Lenses
Grouped into seven clear lenses, each with one simple score.
One
Daily Read
Combined into a single number, from Risk-Off to Risk-On.
The work the analysts do every morning, abstracted into one read you take in at a glance. A map of where things stand. It never tells you to buy or sell.
Four leading lenses combine into one daily number, from Risk-Off to Risk-On.
Live Now
Open the Market Compass.
Live now for Glassnode Advanced and Professional members. Updated every day, with a written read from our analysts.
- Access
- Advanced & Professional
- Updates
- Every day
- Analyst Read
- Written daily
- Today
- 14 / 100 · Risk-Off