

Analyze market activity with precision
Glassnode Studio brings on-chain, spot, and derivatives data into one analytical view. Monitor signals and detect structural shifts in a feature-rich workspace.

Trusted by industry leaders


One intuitive platform.
Designed for clarity and depth.
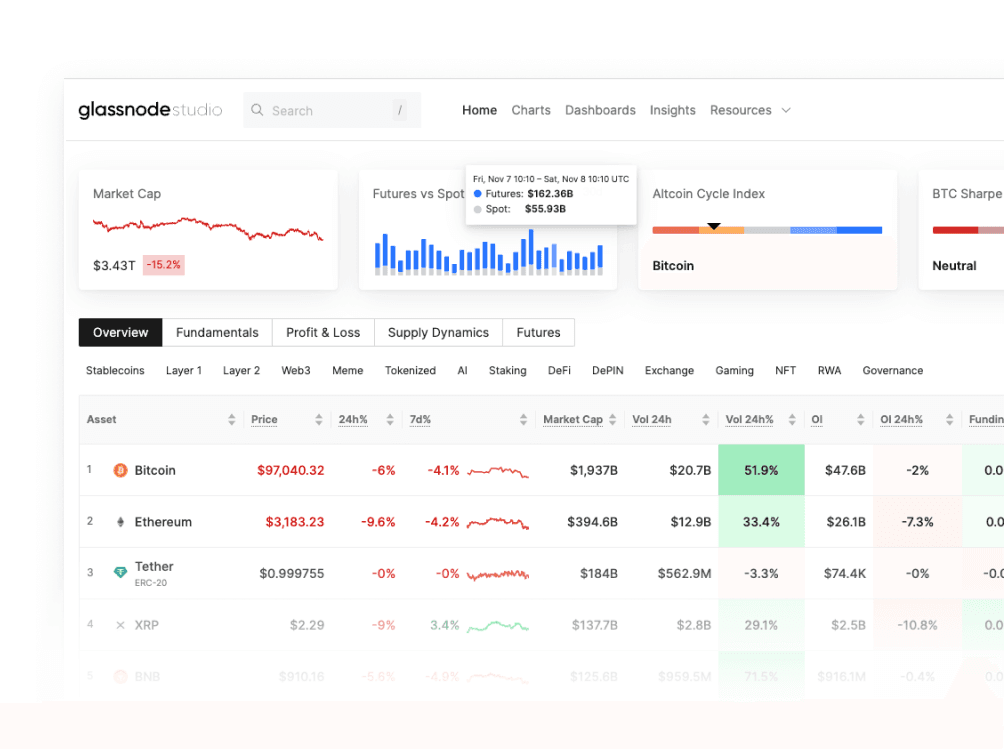
Scan the market at a glance
The front door of Studio gives you a near real-time snapshot of what’s happening across the market.
Compare performance across assets and sectors
Spot market stress, strength or emerging opportunities
Explore preset views that surface key metrics
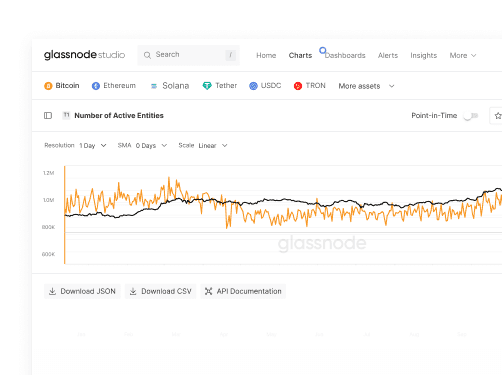
Make complex data easy to interpret
Work with rich data visualizations for any metric in a flexible, no-code charting workspace.
Build fully custom charts to analyze on-chain and market data side by side
Use backtesting mode for strategy optimization based on historical data
Get instant alerts when metrics reach key thresholds
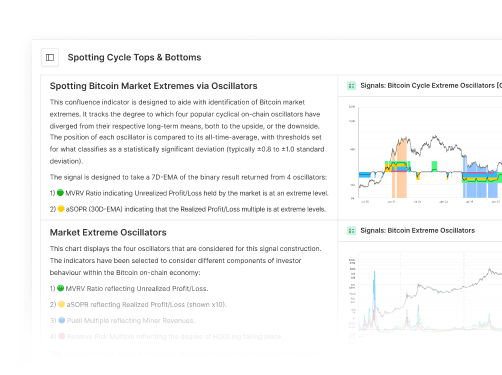
Structure your analysis
Bring your core indicators together in a focused layout, or start from our curated library of expert dashboards.
Build dashboards that align with your research frameworks
Add notes and commentary directly to charts for richer context and synthesis
Effortlessly share your analysis via direct links to streamline collaboration across teams
One unified data platform to amplify
your trading and investments in digital assets.
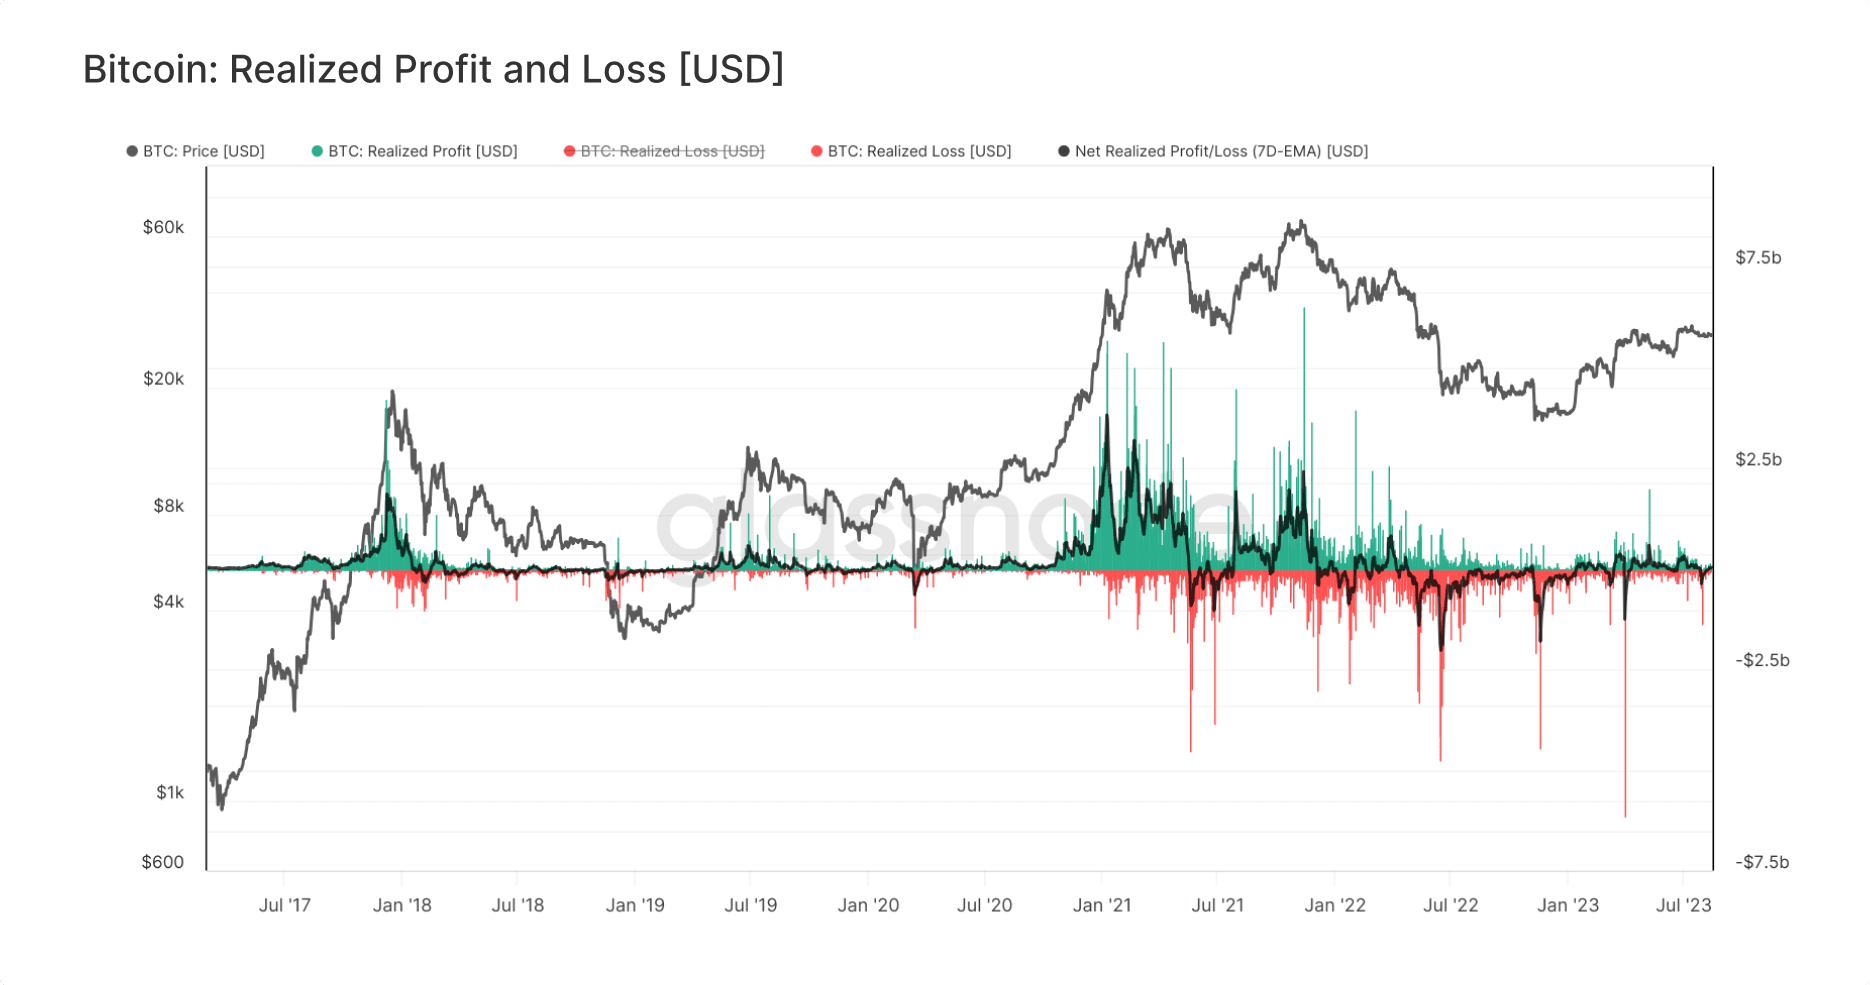
On-chain fundamentals
Measure blockchain activity, growth, and adoption through metrics that reveal the intrinsic value of digital assets using proven valuation techniques.


“We are particularly impressed by the Charts/Dashboards feature, which includes entity balance folder, stablecoin data, spot volumes, and staking capability. We genuinely appreciate the innovative solutions Glassnode Studio offers, and we believe they can add significant value to our operations”
— Andy Chung, Senior Data Analyst, Binance
Contact Institutional Sales
Redefine your organization’s approach to trading and investing in the digital asset market. Reach out to our dedicated sales team and get a tailored demo today.
Rely on tools built for dynamic markets
We evolve our platform with the market so you can stay ahead.